
Tech
How Manufacturers Can Find the Source of Repeated Material Flow Disruptions

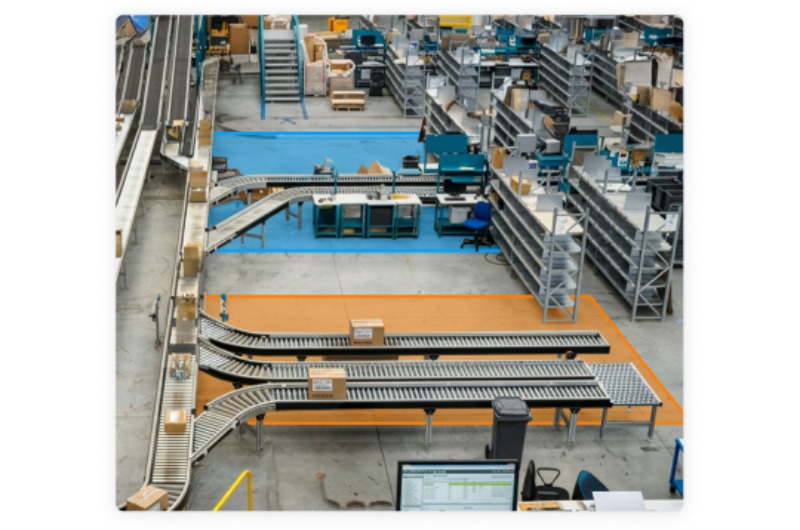
The conveyor starts moving again, so everyone gets back to work. Twenty minutes later, the same section slows down. Production recovers, then another gap appears after lunch.
Repeated material flow disruptions often look like separate incidents on the floor. In reality, several stoppages may trace back to the same upstream condition.
Finding that source matters because clearing the visible problem does little if the cause remains. Manufacturers need to see where movement first becomes unstable, what happens before each interruption, and how the disruption spreads through connected processes.
Start With the Difference Between a Symptom and a Cause
A stopped station tells you where production has been affected. It does not necessarily tell you where the problem began.
Consider a workstation waiting for material. The immediate symptom is easy to see: the operator or equipment has nothing to process. Yet the original cause could sit several stages upstream.
A feeder may be stopping intermittently. An accumulation zone might be draining faster than it is replenished. Packages could be backing up around a transfer point. One process may also be running at a less consistent rate than the next stage expects.
Teams that investigate only the affected workstation can spend time adjusting equipment that is operating correctly.
The better question is: what changed before the flow stopped?
Build a Timeline Around Every Recurring Interruption
Repeated problems become easier to investigate once teams stop treating each event as a standalone failure.
Create a timeline around the disruption. Record when inbound movement first slowed, when the downstream station began waiting, when someone noticed the problem, and when normal production returned.
A useful record can include:
- The line section or transfer point affected
- Start time and duration of the interruption
- Conditions immediately upstream and downstream
- Any buffer or accumulation changes before the stop
- Time needed to restore normal movement
- The shift, product type, or production run involved
One event may reveal little. Twenty similar records can expose a pattern.
Perhaps every disruption begins shortly after a particular product enters the line. Maybe the same transfer point becomes unstable during one shift. A recurring sequence may also show that the visible stoppage consistently appears several minutes after an upstream slowdown begins.
That changes the investigation from “Why did this station stop?” to “Where does this sequence start?”
Separate Starvation From Blocking and Equipment Faults
Different flow problems can create similar symptoms.
Line starvation occurs when a station is available to run but incoming material does not arrive as expected. Downstream blocking creates the opposite problem: completed material cannot leave because the next stage cannot accept it.
A mechanical fault adds another possibility. In that case, equipment itself cannot operate normally.
Those distinctions matter. A maintenance response makes sense for a damaged component, but it will not solve an upstream supply gap. Adding material to a buffer may reduce a temporary starvation event without correcting the process that keeps draining it.
Machine states, production records, and physical movement data should therefore be reviewed together. A generic downtime code rarely gives enough context on its own.
Look for What Happens Before the Output Number Falls
Production reports tell teams how much output they lost. The physical disruption usually starts earlier.
A widening gap between units can be an early warning. So can recurring micro-stops, increasing dwell at a transfer point, or a buffer that steadily empties while the next station remains ready.
Those signals create an investigation window before the loss becomes obvious in shift totals.
They also help explain why apparently minor interruptions deserve attention. A short slowdown upstream may continue feeding downstream processes for several minutes because accumulated material acts as a buffer. Once that stock runs out, the later station finally stops.
The output loss appears downstream, while the original problem occurred somewhere else.
Compare Events Across Shifts and Production Conditions
A disruption that appears random on Tuesday may look much less random after several weeks of data.
Group recurring events by line section, shift, time of day, product profile, and duration. Manufacturers can then see if interruptions cluster around particular operating conditions.
Repeated belt jams offer a useful example. If one conveyor section blocks far more often during a certain product run, package dimensions or spacing may deserve investigation. If incidents concentrate on one shift, differences in setup, maintenance routines, material delivery, or work practices may provide useful clues.
Recovery time matters too.
Two sections might record the same number of interruptions, yet one returns to normal within a minute while another causes a prolonged slowdown. Frequency alone would make them look equally important. Production impact tells a different story.
Add Physical Context to System Data
MES, WMS, PLC, and equipment records can provide accurate timestamps and machine states. What they may not show is the physical condition surrounding an interruption.
That missing context can slow an investigation.
Configured computer vision can help manufacturers monitor movement across selected zones and compare observed flow with expected process patterns. Protex AI Flow Stability, for example, identifies flow disruptions, line starvation, and belt jams while tracking factors such as frequency, duration, and recovery time.
Video context can then show conditions around the event, such as missing incoming material, a sequencing gap, congestion, or a blockage. Teams get evidence tied to the same period as their operational records rather than relying solely on memory after the shift ends.
That combination helps narrow the search for an upstream source.
Measure the Fix, Not the Closed Work Order
Finding a likely cause is only part of the job. Manufacturers also need to confirm that corrective action changed the pattern.
Suppose an engineering team adjusts a transfer point after recurring jams. Compare the period before and after that change. Did disruption frequency fall? Did average recovery become shorter? Are fewer units being lost? Has the same problem moved somewhere else?
A closed maintenance ticket proves that work took place. It does not prove that flow became more stable.
The same principle applies to routing changes, revised standard operating procedures, buffer adjustments, or maintenance fixes. Track performance long enough to see if the original pattern returns.
Repeated Disruptions Leave Clues
Manufacturers rarely need to accept recurring flow interruptions as unexplained background noise.
Each event leaves evidence: where movement slowed, what happened beforehand, how long the disruption lasted, which conditions were present, and how the line recovered.
The challenge is connecting those clues across enough events to reveal the pattern.
Once teams can trace interruptions upstream and compare physical conditions with system records, investigations become far more focused. Instead of repeatedly clearing the same symptom, operations and engineering teams can address the process condition that keeps bringing it back.
That is where the larger production gain often sits. Not in restarting the line faster, but in stopping the same disruption from returning tomorrow.



How Manufacturers Can Find the Source of Repeated Material Flow Disruptions

How to Compare Online Gold Buyers Before Selling Precious Metals

The Words Behind Msb Mario’s Spoken Word

Alicia Lacao-Green gains worldwide fame owing to her amazing transformations via make-up and contouring.

Amplifyou, an amazing agency for eCommerce

Vasid Qureshi, India’s Top Blogger Shares 5 Tips to Go Viral on Social Media
How Manufacturers Can Find the Source of Repeated Material Flow Disruptions
The conveyor starts moving again, so everyone gets back to work. Twenty minutes later, the same section slows down. Production...

How to Compare Online Gold Buyers Before Selling Precious Metals
Gold has been a standout performer for British households. Gold price hit a record £4,068.11 on 2 March 2026, and...

The Words Behind Msb Mario’s Spoken Word
An interview on the writing behind selected works. Msb Mario, also known as “El Niño de la Pili,” is a...

How VMNewswire Fits Into a Startup Launch Communication Plan
A startup launch involves more than announcing that a company exists. Prospective customers need to understand the problem being addressed,...


Ann Brandau Explains Why Healthcare Analytics Only Matters If Someone Acts on It
Few hospitals are short on data. Claims, quality measures, staffing reports, patient-experience surveys, and payer statements come in every week,...
-

 Sports4 weeks ago
MLB 2026 Playoffs: Full Postseason Schedule, Wild Card and World Series Dates, Games, and TV Networks
-

 Science4 weeks ago
September 2026 Full Moon: When, Where, and How to See the Harvest Moon
-

 Tech4 weeks ago
Google Will Replace Gemini Gems With Skills in November 2026
-

 Gadget4 weeks ago
How to Customize AirPods Settings in iOS 27
-

 Business4 weeks ago
Gastauer Family Office Gives Nature Finance A Longer Time Horizon
-

 Health4 weeks ago
The Beauty of Being Yourself: Brigitta Würfl’s Approach to Timeless Aesthetics
-

 Business3 weeks ago
Outgrowing Isn’t Giving Up: Hayson Tasher Sr. on Choosing Growth
-

 Tech4 weeks ago
AirPods Get Custom EQ and Other New Features With Latest Update